Color Grid Visualization
The script described in this document outputs an SVG of MTP’s color grid. It visualizes the spatial and intensity models explained in Grid and Coordinate System, and is intended as a basis for a planned interactive generative UI.
Grid variants
Section titled “Grid variants”Several SVGs are checked in under public/images/grids/. The package.json scripts map includes build:grid, build:grid-10x10, build:grid-28x28, and build:grid-37x37 so each asset can be regenerated from scripts/mtp_grid_generator.py without hand-editing paths.
File names use line counts per side (grid intersections): an N×N cell checkerboard is bounded by (N+1)×(N+1) lines, so the default 18×18 cells → mtp-grid-19x19.svg.
| Preview | Lines (per side) | Cells | Path |
|---|---|---|---|
 | 37×37 | 36×36 | public/images/grids/mtp-grid-37x37.svg (build:grid-37x37) |
 | 28×28 | 27×27 | public/images/grids/mtp-grid-28x28.svg (build:grid-28x28) |
 | 19×19 | 18×18 | public/images/grids/mtp-grid-19x19.svg (build:grid) |
 | 10×10 | 9×9 | public/images/grids/mtp-grid-10x10.svg (build:grid-10x10) |
How it works
Section titled “How it works”The generator uses one spatial model and one palette set; only the grid size (and pixel cell size) changes between presets. The default asset is an 18×18 cell grid (the cell regions bounded by 19×19 line intersections).
- Cell color comes from the hue cycle — for each cell, it is determined by the angle from the center.
- Opacity / brightness comes from Chebyshev distance (Volcano model). Intensity peaks at distance 6 and falls off toward the center and the outer frame.
- Under the color grid, a checkerboard layer indicates transparency. The background rectangle, checkerboard colors, and palette pairs are defined at the top of the script.
Strict specification of primary or hue-wheel colors is not required, but the script is designed to respect the grid’s color relationships. The script defines an inner_palette and outer_palette: these are the inner and outer anchor colors within a single SVG.
Generating the SVG
Section titled “Generating the SVG”From the repository root:
npm run build:gridnpm run build:gridsThe npm scripts write directly to their matching files under public/images/grids/. To emit raw SVG to standard output instead, call the Python generator directly:
python3 scripts/mtp_grid_generator.py --grid-28x28python3 scripts/mtp_grid_generator.py --grid-37x37MTP Interactive UI preview
Section titled “MTP Interactive UI preview”The planned MTP Interactive UI uses the generated 19×19 SVG color grid as the central coordinate surface. The images below show light and dark UI previews with the grid placed in the middle and coordinate labels around the frame.
| Light | Dark |
|---|---|
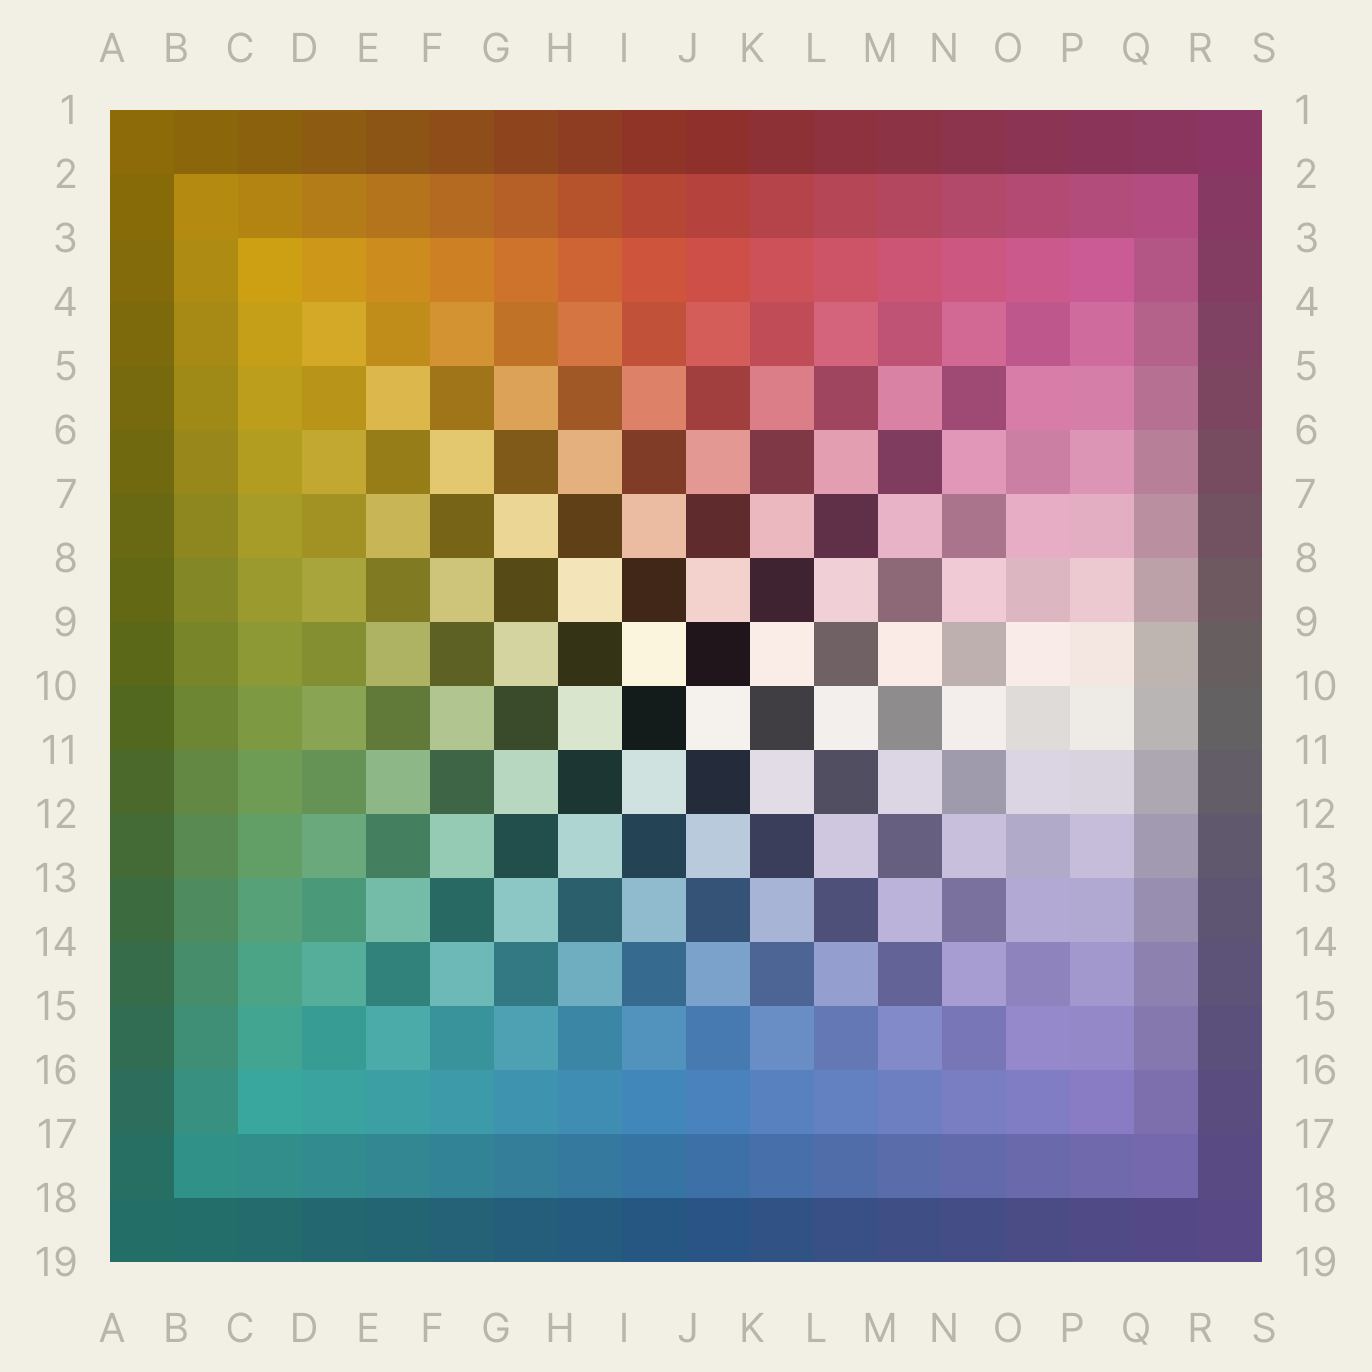 | 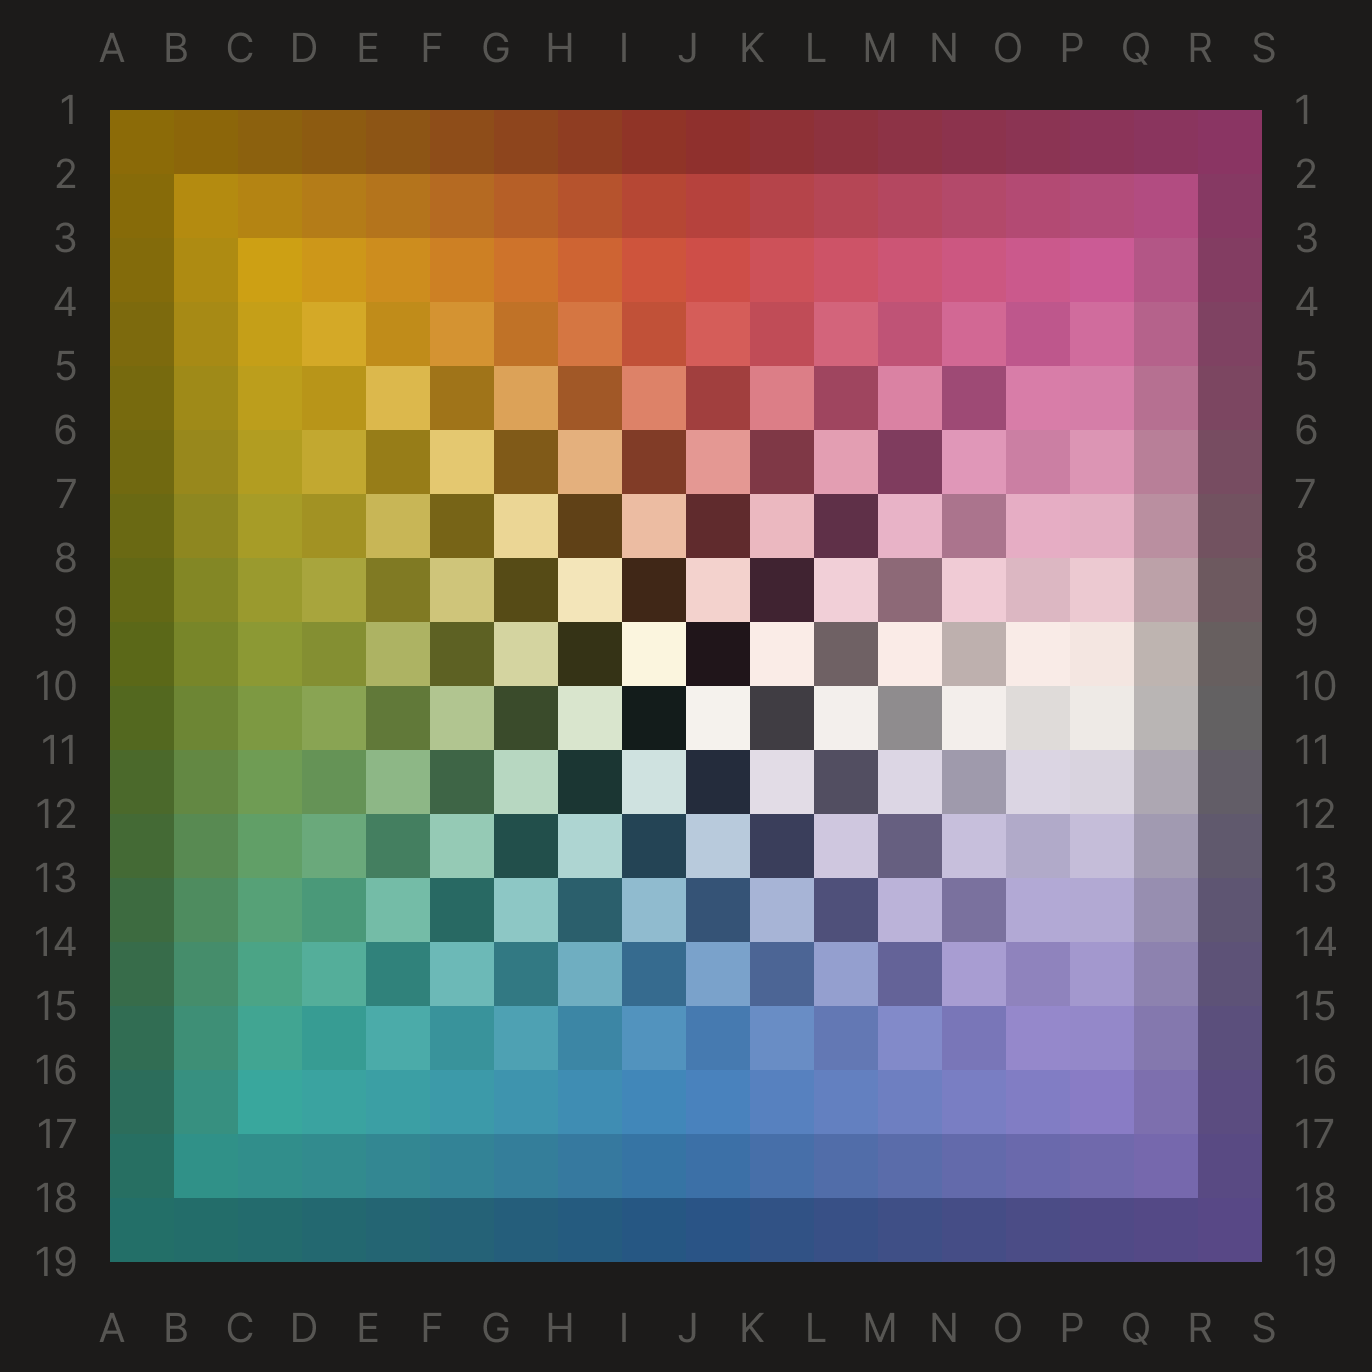 |
The center image in this UI preview is generated from scripts/mtp_grid_generator.py as the default mtp-grid-19x19.svg. The UI frame adds column labels A–S and row labels 1–19, so the same view can also be used as a reference sheet for locating /mtp <column:row> inputs.
For example, J:10 marks the neutral center, while coordinates such as J:4, D:16, or P:16 can be read directly from the labeled grid before being passed to /mtp.