
MTP Is a Framework for Tuning LLM Output
MTP (Mapping the Prompt) is a framework for steering LLM output with grids and sliders instead of long natural-language behavior instructions. It is designed to make the ideas and concepts in a prompt easier to express intuitively, helping the user and the LLM align with fewer instructions.
Its core is a 3x3 color arrangement made of nine nodes. The relationships between color, position, polarity, and intensity are defined from this arrangement. Each color in the 3x3 arrangement defines nodes for the Side A and Side B polarities. For example, Yellow in the upper-left corresponds to Open on Side A and Still on Side B.
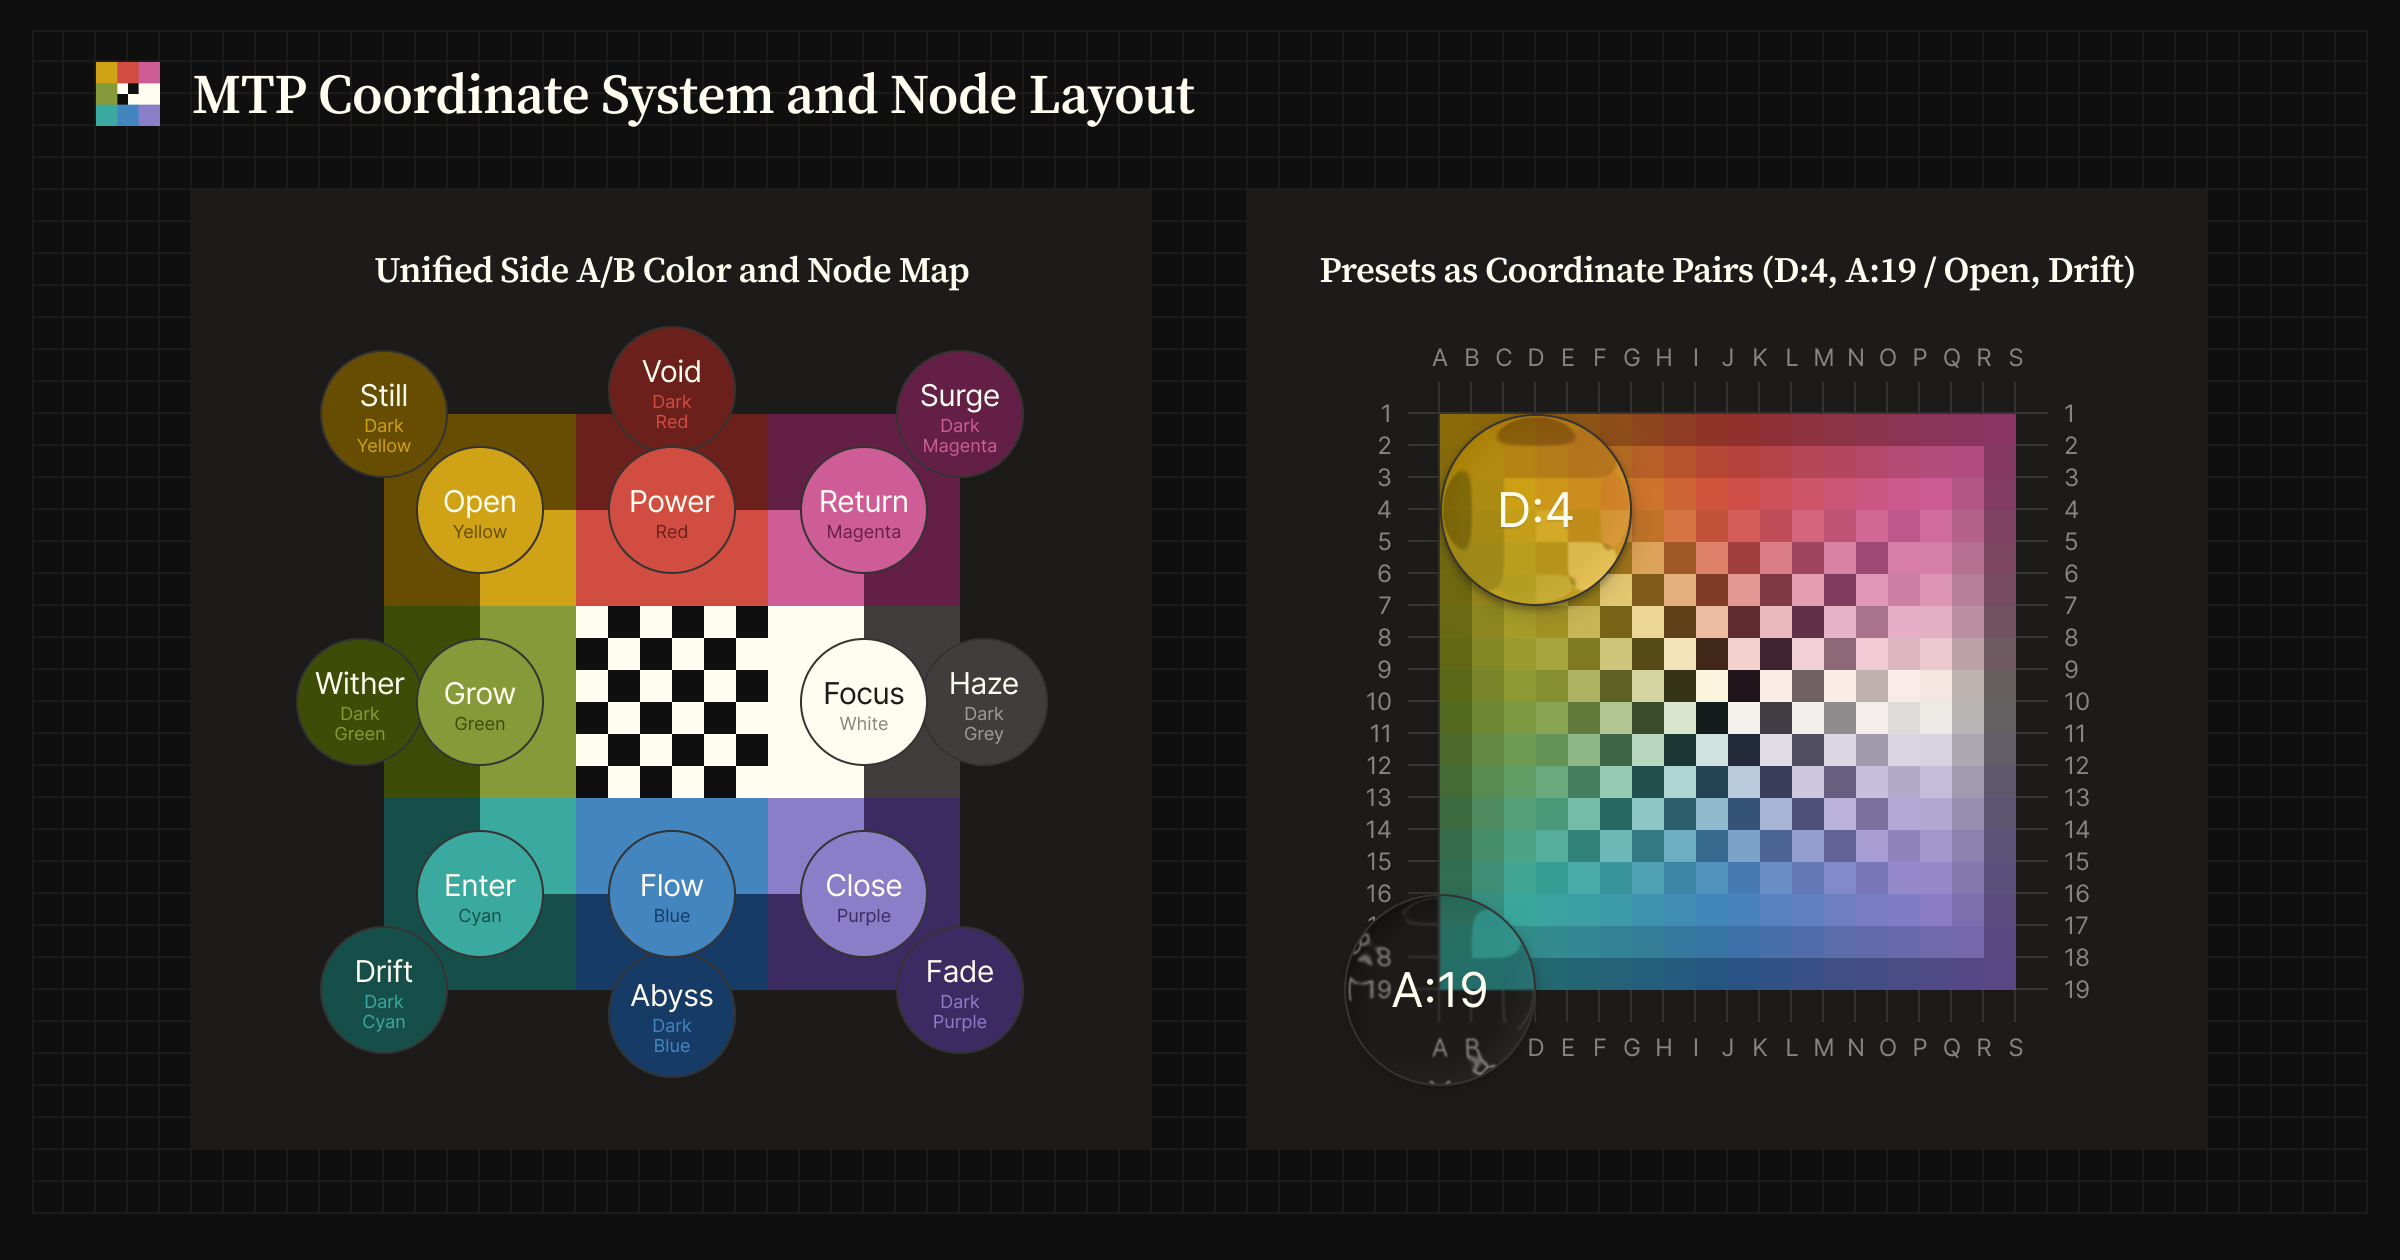
The column:row color grid on the right shows an image for unifying Side A and Side B nodes and treating them as coordinates in a UI. It shows an example using the D:4 and A:19 coordinates.
MTP Skill is an Agent Skill for using the MTP framework through the /mtp command.
What is MTP?
Section titled “What is MTP?”Traditional prompts often adjust model behavior through natural-language instructions like these:
Act as an expert.
Be more concise.
Think step by step.
MTP moves that behavioral steering into non-verbal parameters such as color, position, and intensity. It does not change the task itself; it adjusts qualities such as force, flow, depth, structure, openness, and focus.
Three ways to control output
Section titled “Three ways to control output”MTP Skill supports three input modes. Internally, each mode resolves into the same form: axis, polarity, and intensity.
| Mode | Pattern | Use it when |
|---|---|---|
| Slider | power:100, flow:70, haze:50 | You need explicit controls that are easy to read. |
| Grid | J:4, D:16, A:1 | You want compact steering through coordinates. |
| Preset | strategist, synthesizer, maverick, concierge | You want a reusable blend of multiple coordinates. |
# Slider/mtp power:100 Summarize this article
# Grid/mtp J:4 Explain this concept
# Preset/mtp strategist Compare these options
Slider and Grid UI Preview
Section titled “Slider and Grid UI Preview”The MTP Interactive UI on the roadmap is planned to make sliders and grids available as visual controls. The UI is not implemented yet; at the current stage, MTP Skill is operated through the /mtp command.
The images below show a UI preview of sliders for controlling intensity and a grid for controlling position. They make it easier to see how coordinates such as J:4 and D:16 correspond to color and position. The slider view and the grid view both represent the same node system from different angles.
Slider
Section titled “Slider”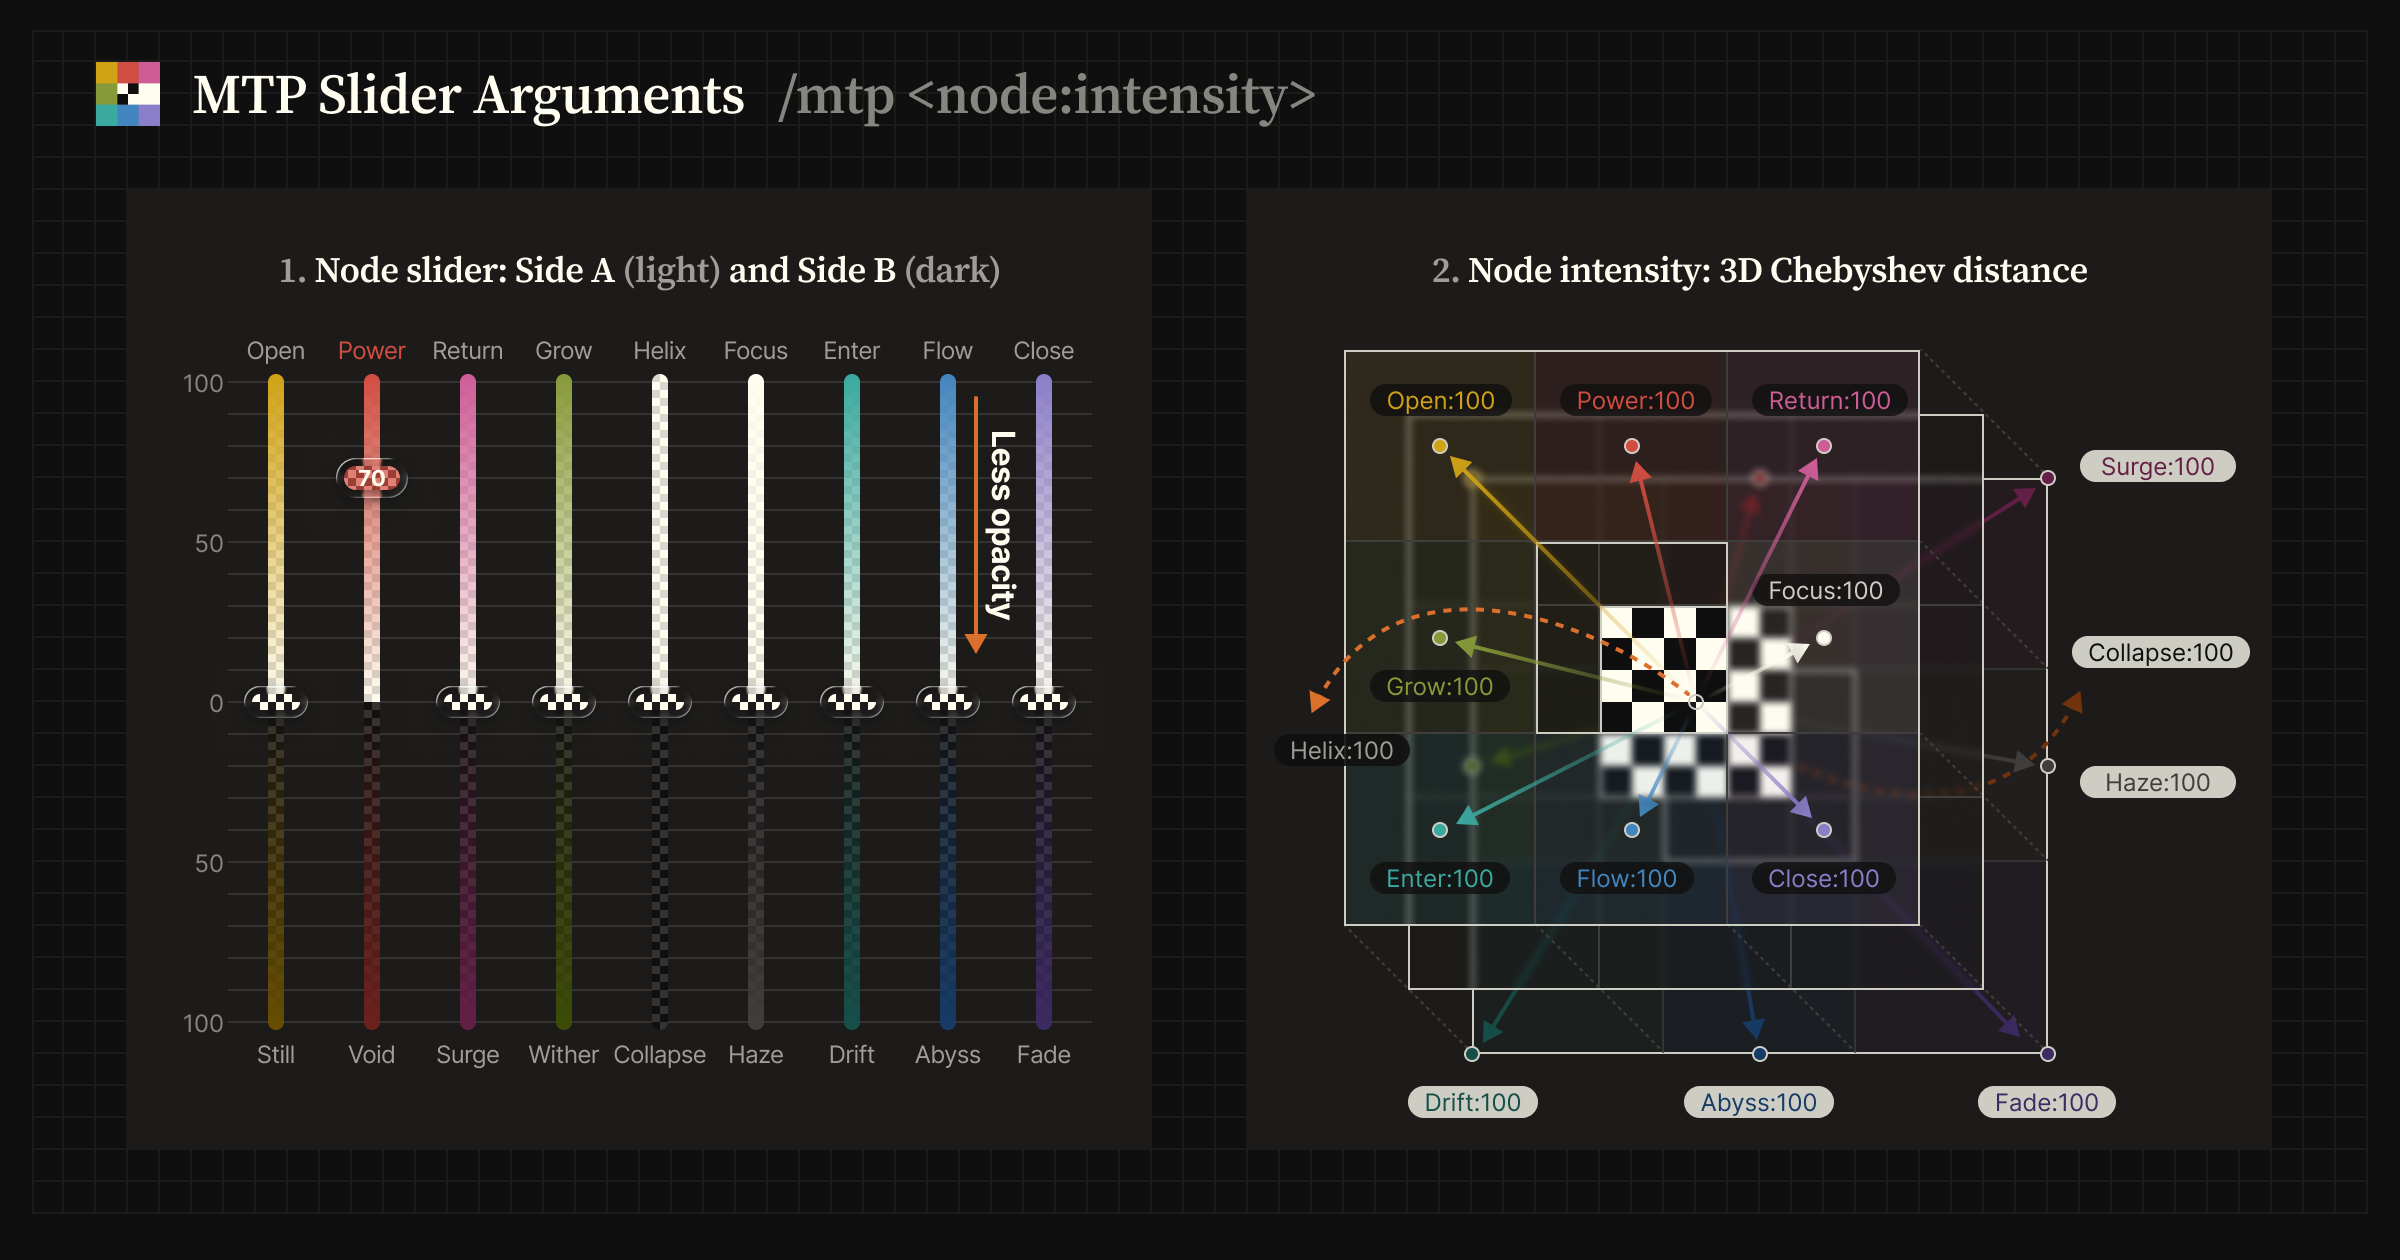
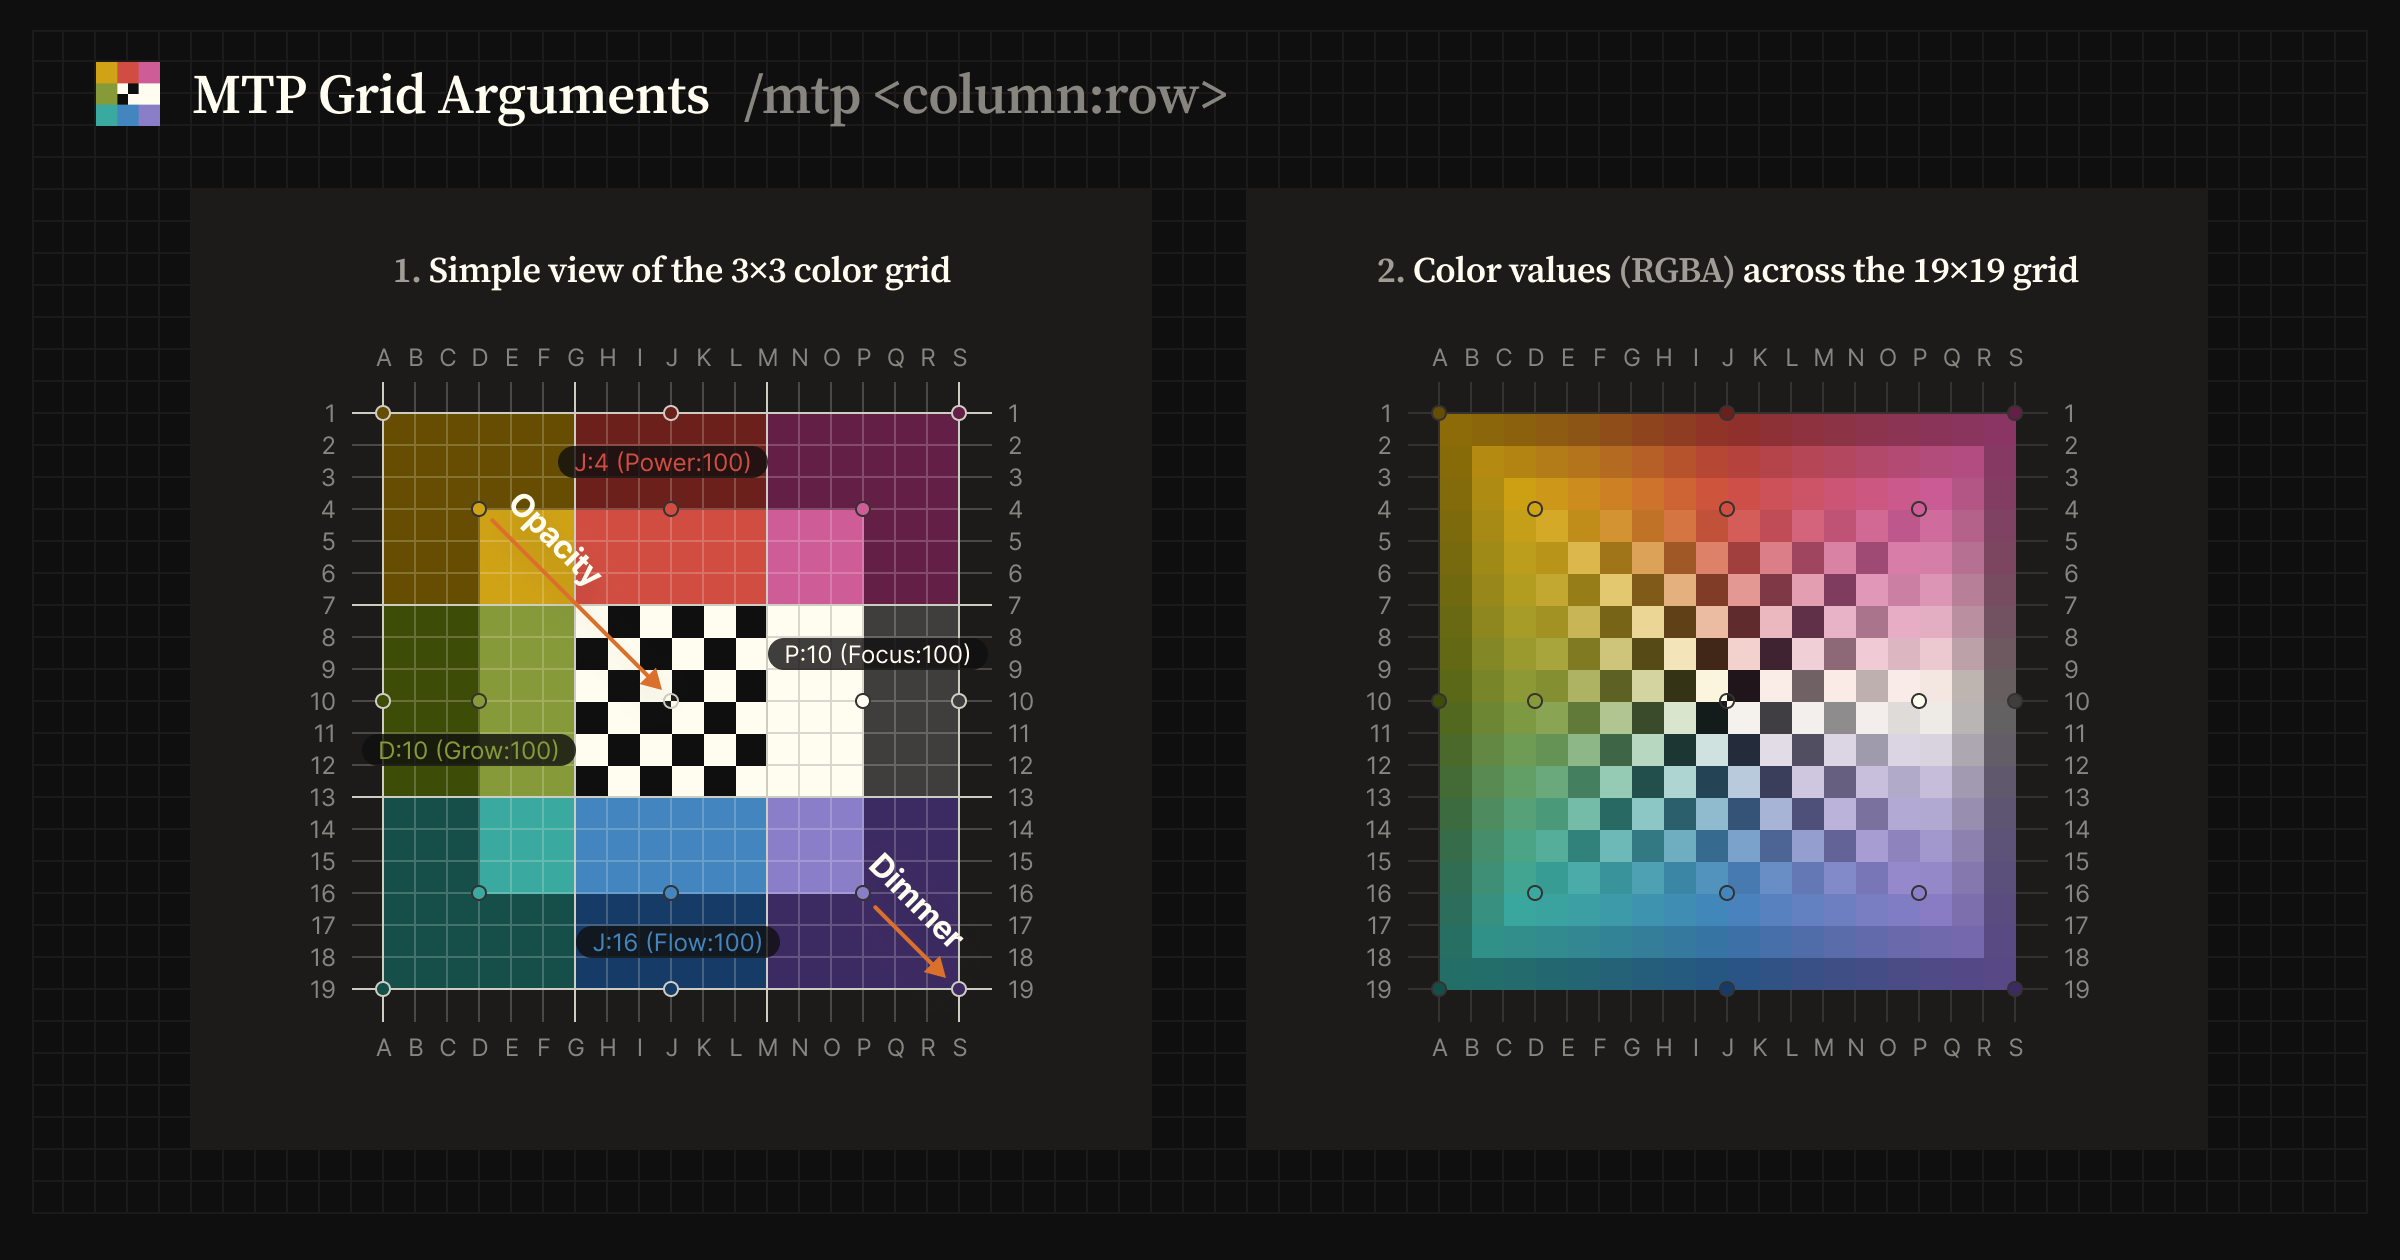
In the grid UI, position is intended to be selected as if placing a point on the grid.